
WooCommerce vs PrestaShop in France: 59,778 vs 20,555 online stores
PrestaShop generates more cumulative revenue than WooCommerce in France — with three times fewer stores. This is the central paradox of this comparison: WooCommerce powers 59,778 French online stores, nearly 3 times the volume of PrestaShop (20,555 stores). Yet PrestaShop's ecosystem achieves an annual cumulative GMV of €5.4 billion, compared to €4.1 billion for WooCommerce. A PrestaShop store generates a median €52,097/year, which is 2.4 times the median GMV of a WooCommerce store (€22,046/year). Store count is not an indicator of commercial strength.
This asymmetry reflects two fundamentally different usage philosophies. WooCommerce is the platform of craftspeople, independent workers and creators: 31.3% of WooCommerce stores belong to Sole Traders, and the Arts and Crafts sector accounts for 14.2% of the ecosystem — the platform's number one sector. PrestaShop, conversely, is the platform of structured merchants: 42.2% are SAS, 37.5% are SARL, 76% of these companies have been trading for over 10 years, and 20.7% are present on marketplaces (versus 4.2% for WooCommerce). The two platforms coexist in the French market without directly competing — they do not address the same merchant profile.
This analysis is based on the July 2026 database of lebot.in, comprising 155,000 French e-commerce companies verified by SIREN. CMS detection is performed on active sites; monthly traffic is measured via SimilarWeb; GMV is estimated through cross-modelling of sector × traffic × conversion rate. Only stores whose SIREN appears in their legal notice and is active in the INSEE register are counted.
The comparison that truly matters
Comparing WooCommerce and PrestaShop purely by store count is like comparing a supermarket chain to a network of wine merchants by number of outlets. Volume says nothing about revenue, buyer profiles, or the maturity of the players involved. This comparison offers a six-dimensional analysis: traffic, business sectors, geography, company profiles, GMV, and marketplace presence.
The relevant question is not "which platform is most popular?" but "for which use case does each platform generate the most value?" The data answers clearly: WooCommerce excels for creators, craftspeople and independent workers who want to quickly launch an online store integrated with a WordPress site. PrestaShop stands out for merchants with an established commercial activity, complex catalogue requirements and marketplace ambitions.
Two figures summarise the structural divergence between the two platforms. On one side, 62.3% of PrestaShop stores exceed 1,000 monthly visits — a sign of established merchants with a loyal audience. On the other, 69.3% of WooCommerce stores remain below 1,000 visits/month — an ecosystem predominantly made up of small sites in the start-up phase or peripheral to a main business activity.
Dashboard: key indicators head-to-head
The following seven indicators form the summary dashboard of this comparison, positioning each platform across dimensions of volume, performance and maturity.
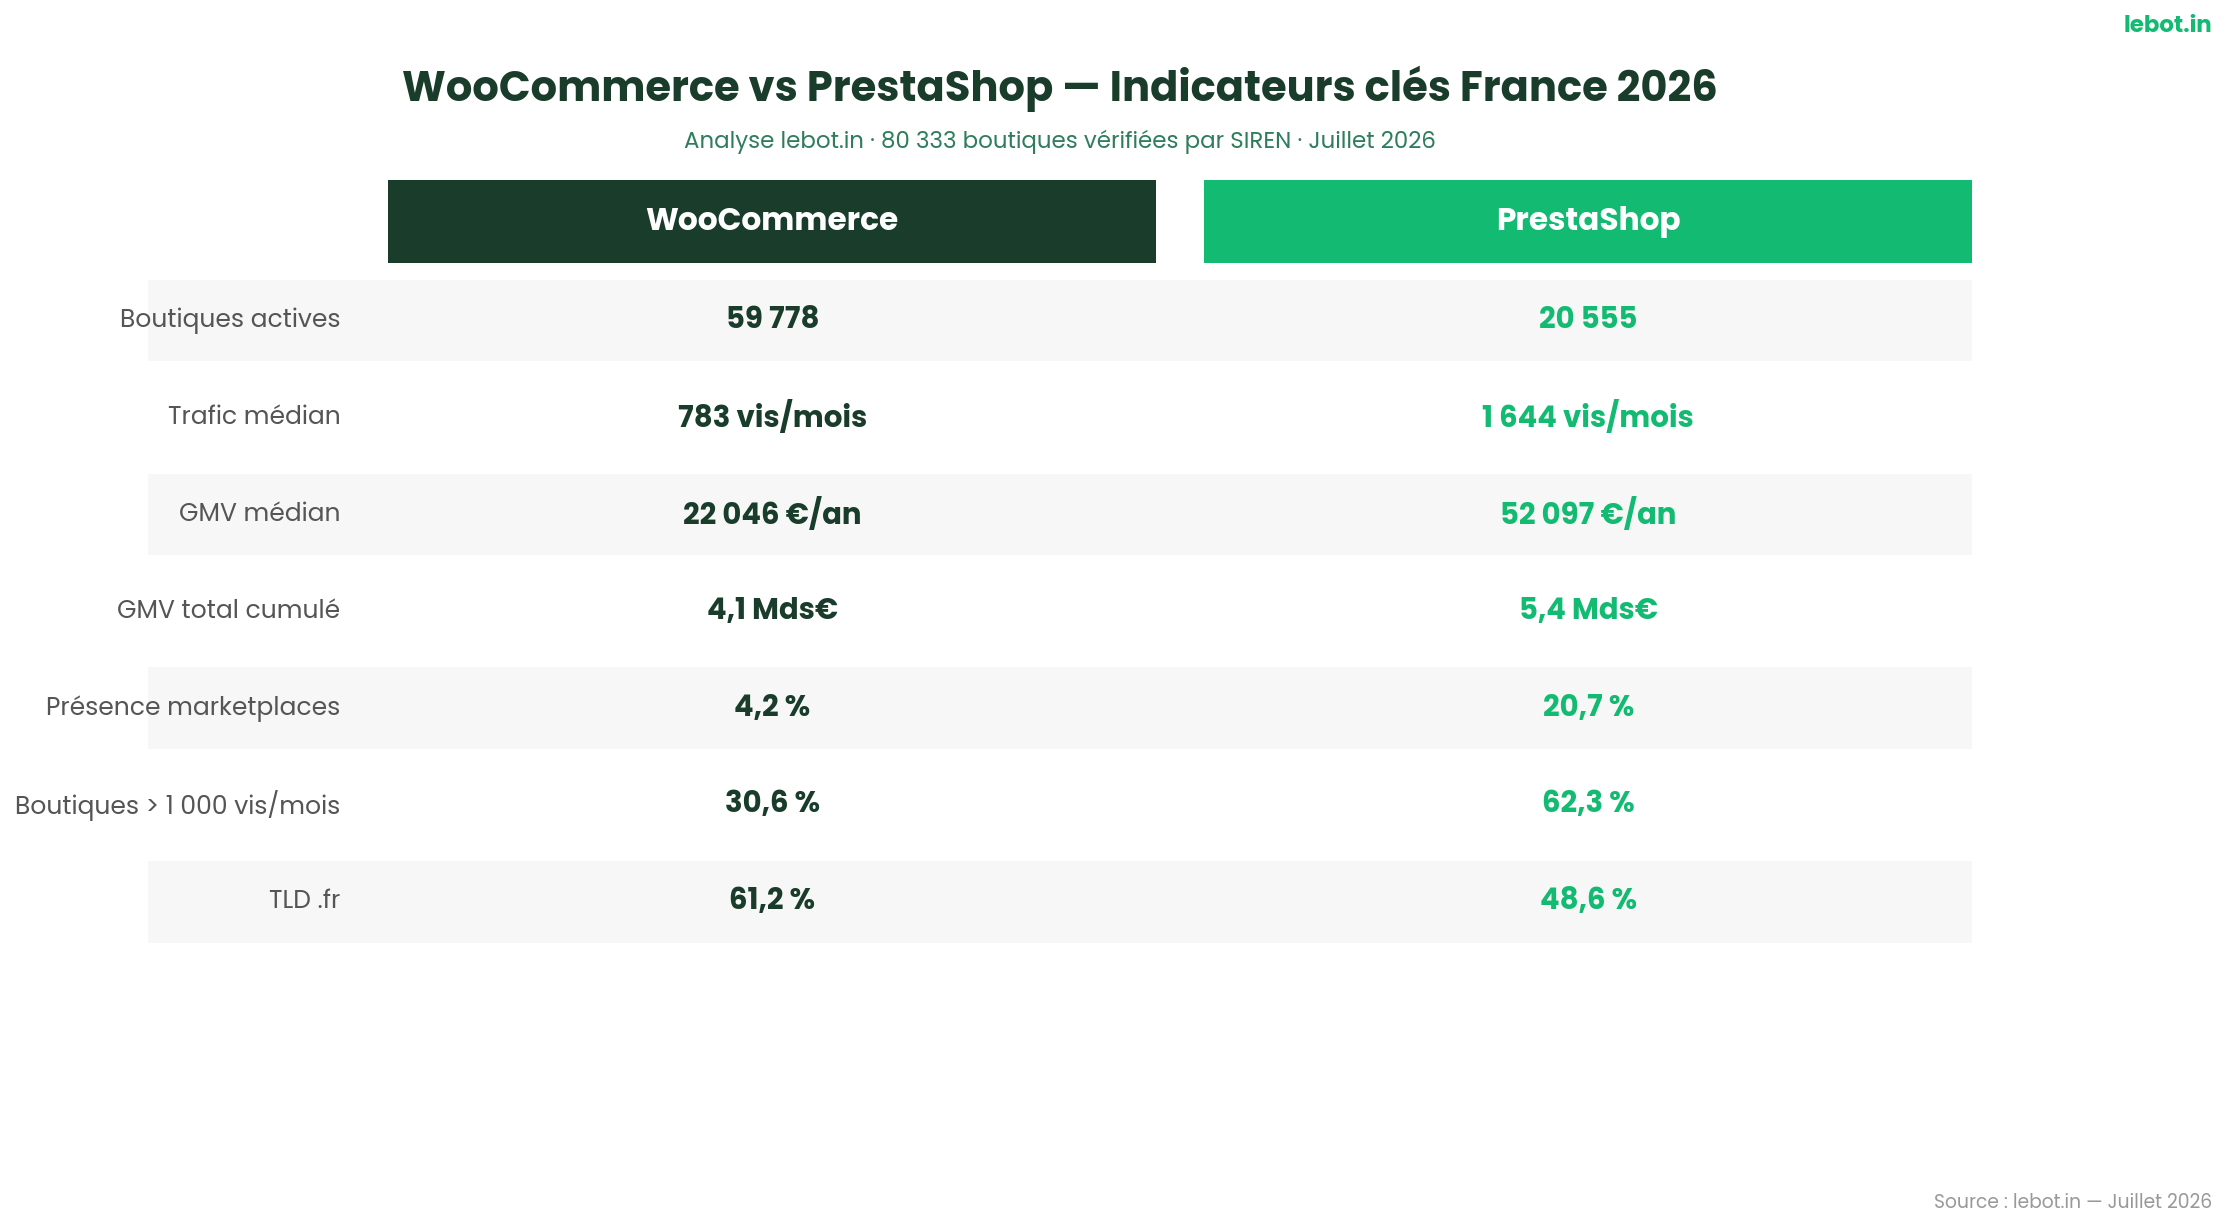
| Indicator | WooCommerce | PrestaShop |
|---|---|---|
| Active stores | 59,778 | 20,555 |
| Median traffic | 783 visits/month | 1,644 visits/month |
| Median GMV | €22,046/year | €52,097/year |
| Total cumulative GMV | €4.1bn/year | €5.4bn/year |
| % stores > 1,000 visits/month | 30.6% | 62.3% |
| Marketplace presence | 4.2% | 20.7% |
| .fr TLD | 61.2% | 48.6% |
PrestaShop's median traffic (1,644 visits/month) is 2.1 times higher than WooCommerce's (783 visits/month). The gap in median GMV is even more pronounced: PrestaShop stores generate 2.4 times more revenue per site. Marketplace presence (20.7% vs 4.2%) illustrates the tendency of PrestaShop merchants to adopt a multichannel strategy, consistent with their profile as structured merchants.
The higher .fr TLD rate among WooCommerce stores (61.2% vs 48.6%) indicates that WooCommerce is more deeply rooted in the domestic French market, while PrestaShop, with 47.1% .com domains, displays a more pronounced international dimension.
Traffic distribution and performance
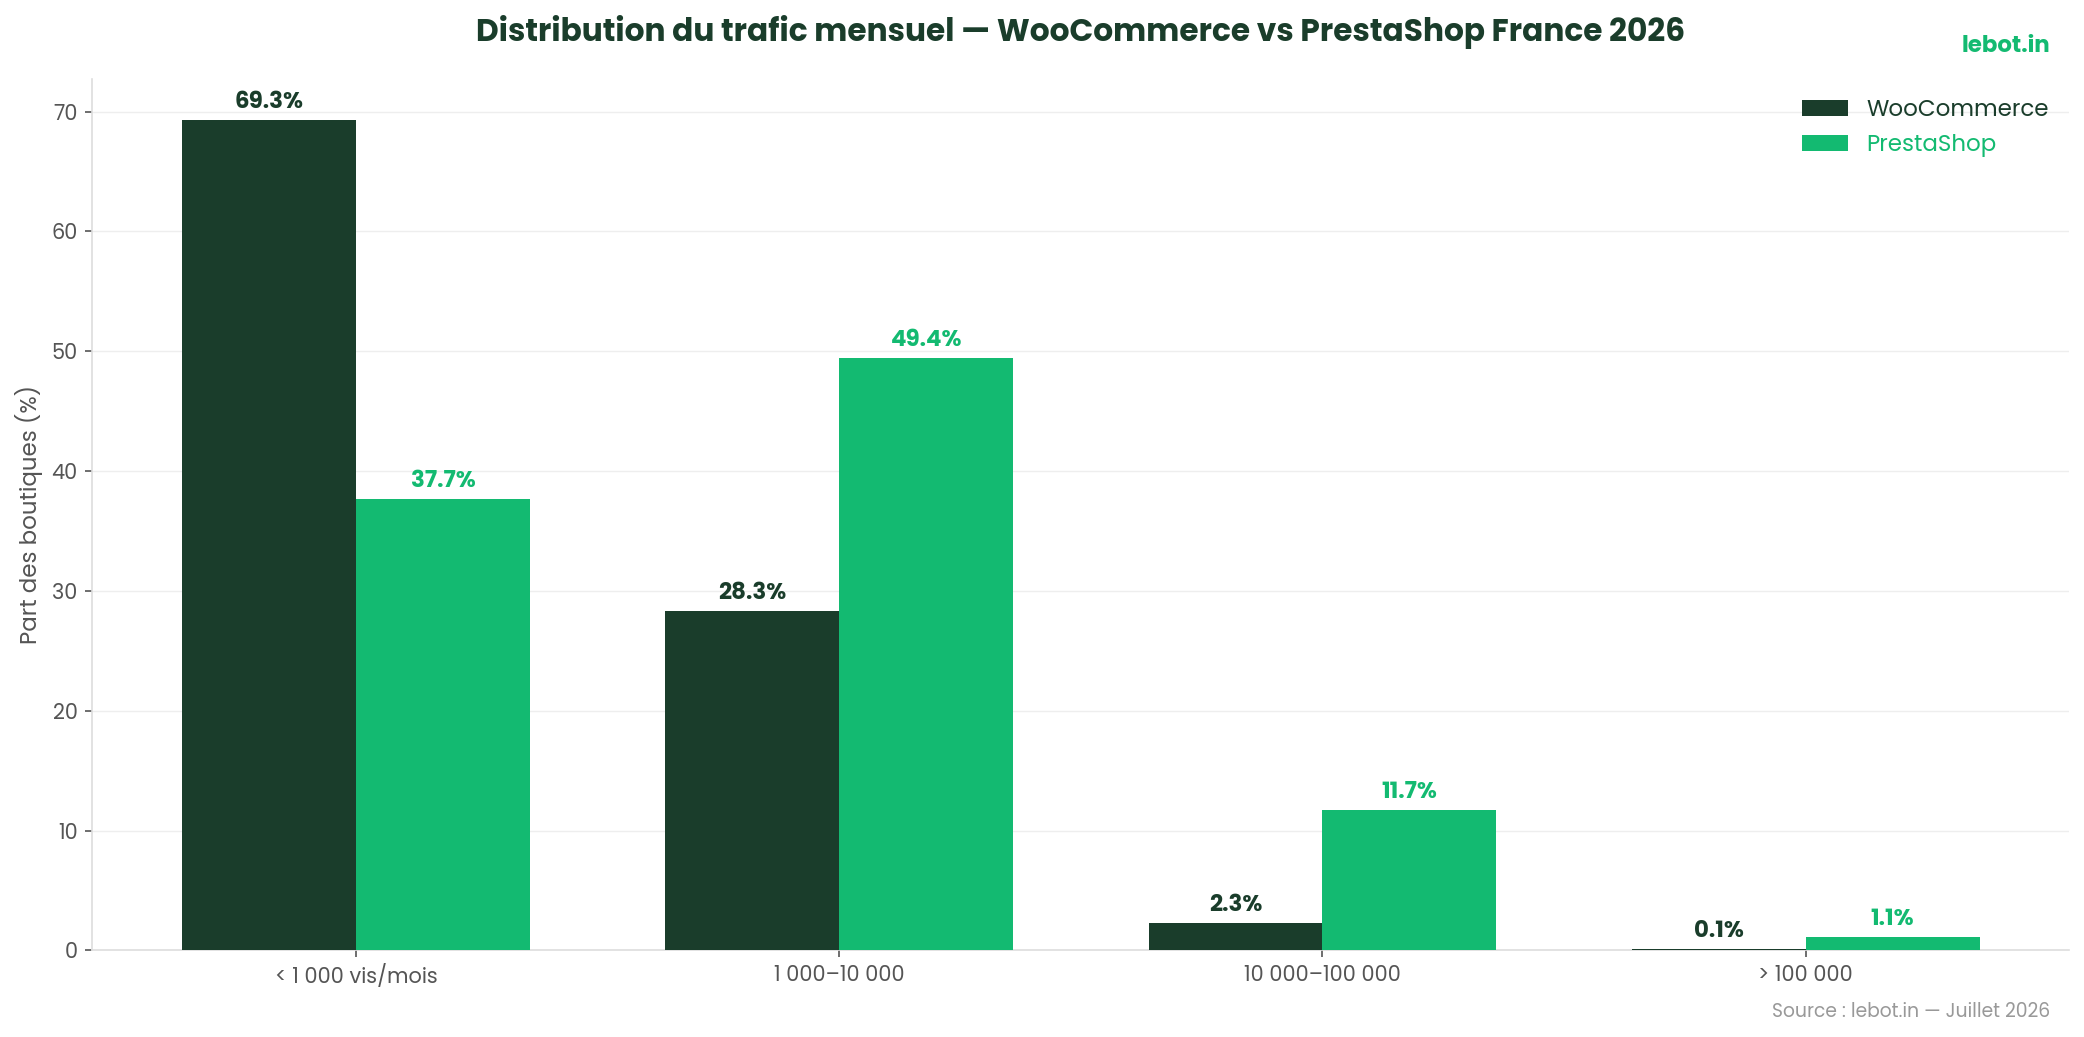
The traffic distribution reveals the deep structure of each ecosystem. WooCommerce displays a pyramid heavily concentrated at the base: the vast majority of stores generate low traffic. PrestaShop shows a much more balanced distribution, with most merchants in the mid-range segment.
WooCommerce traffic distribution
| Traffic segment | Number of stores | Share of ecosystem | Median traffic in segment |
|---|---|---|---|
| < 1,000 visits/month | 41,453 | 69.3% | 194 visits/month |
| 1,000 – 10,000 visits/month | 16,888 | 28.3% | 1,751 visits/month |
| 10,000 – 100,000 visits/month | 1,361 | 2.3% | 18,417 visits/month |
| > 100,000 visits/month | 76 | 0.1% | 197,478 visits/month |
PrestaShop traffic distribution
| Traffic segment | Number of stores | Share of ecosystem | Median traffic in segment |
|---|---|---|---|
| < 1,000 visits/month | 7,747 | 37.7% | 382 visits/month |
| 1,000 – 10,000 visits/month | 10,164 | 49.4% | 2,156 visits/month |
| 10,000 – 100,000 visits/month | 2,408 | 11.7% | 19,948 visits/month |
| > 100,000 visits/month | 236 | 1.1% | 156,247 visits/month |
The gap at the top of the pyramid is striking: PrestaShop has 236 stores exceeding 100,000 visits/month, versus only 76 for WooCommerce — 3 times more with an ecosystem almost 3 times smaller. In the > 100,000 visits segment, median traffic is 156,247 visits/month for PrestaShop versus 197,478 for WooCommerce, indicating that WooCommerce's giants are individually even larger, but remain exceptional.
For PrestaShop, the 1,000–10,000 visits/month segment represents the core of the ecosystem at 49.4% — the majority of stores. For WooCommerce, this same segment accounts for only 28.3%. This structural difference explains the bulk of the median GMV gap between the two platforms.
Business sectors
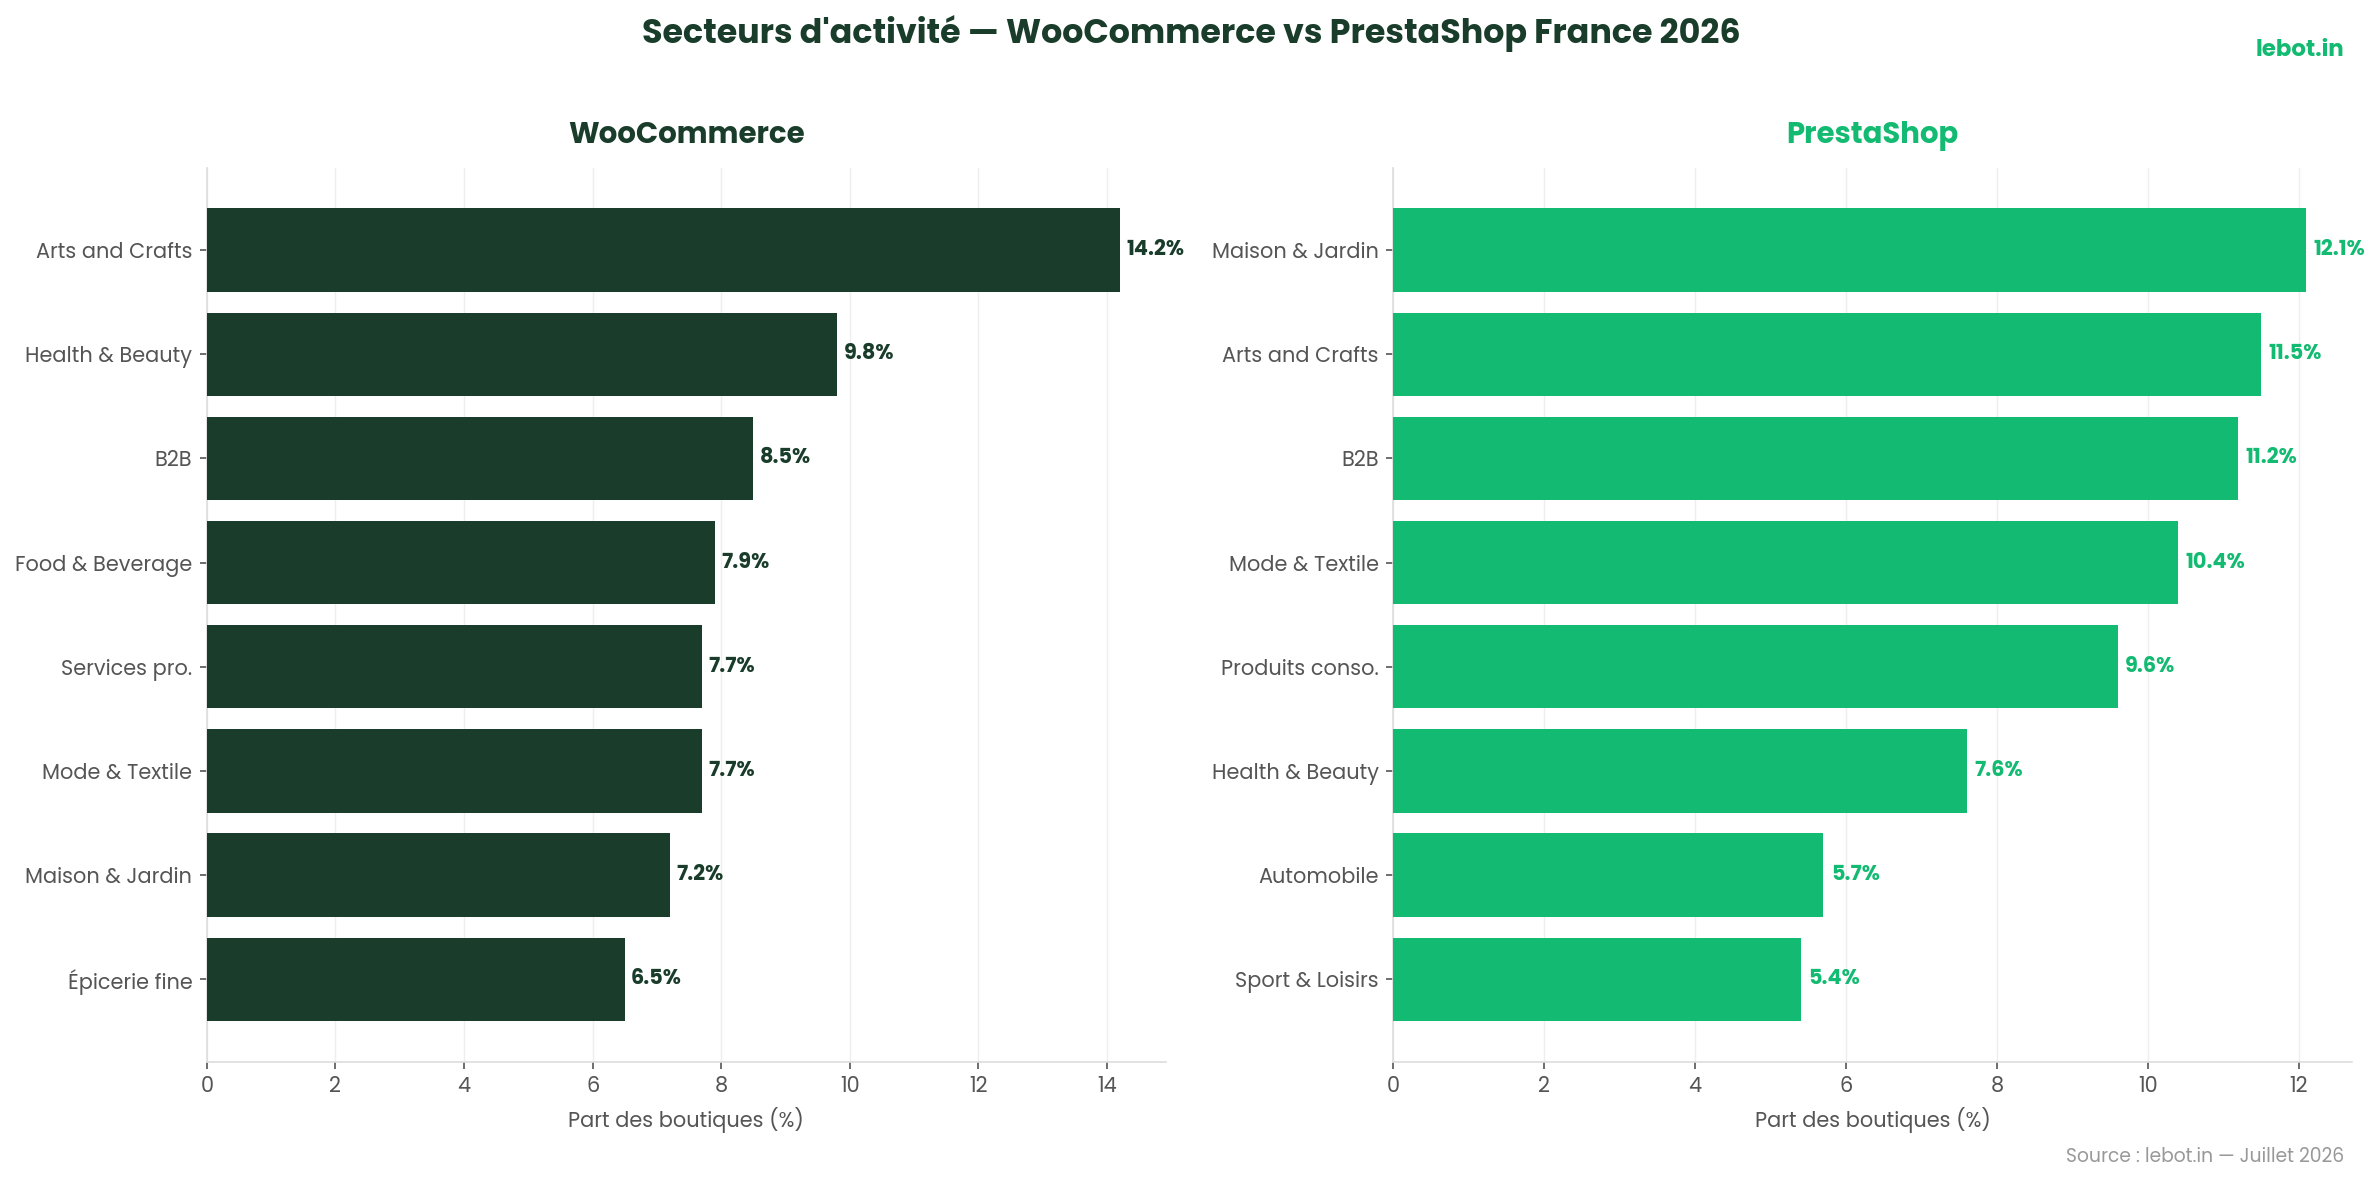
Business sector data reveals two distinct market positions. WooCommerce is dominated by creators and craftspeople, with Arts and Crafts in first position. PrestaShop is more oriented towards general-merchandise merchants and sectors with high purchase frequency.
Top 8 WooCommerce sectors
| Sector | Share of stores |
|---|---|
| Arts and Crafts | 14.2% |
| Health and Beauty | 9.8% |
| Business-to-Business | 8.5% |
| Food and Beverage | 7.9% |
| Professional Services | 7.7% |
| Fashion and Apparel | 7.7% |
| Home and Garden | 7.2% |
| Specialty Food | 6.5% |
Top 8 PrestaShop sectors
| Sector | Share of stores |
|---|---|
| Home and Garden | 12.1% |
| Arts and Crafts | 11.5% |
| Business-to-Business | 11.2% |
| Fashion and Apparel | 10.4% |
| Consumer Goods | 9.6% |
| Health and Beauty | 7.6% |
| Automotive | 5.7% |
| Sports and Leisure | 5.4% |
Arts and Crafts is WooCommerce's top sector at 14.2% — an over-representation reflecting the platform's appeal to creators and craftspeople seeking an accessible e-commerce solution integrated with WordPress. For PrestaShop, this sector drops to second place (11.5%), overtaken by Home and Garden (12.1%).
The Automotive category, absent from WooCommerce's top 8, accounts for 5.7% of PrestaShop stores — consistent with PrestaShop's historical strength in the spare parts and automotive accessories market. The Consumer Goods sector (9.6%) in PrestaShop confirms the platform's generalist positioning on mass-market products.
Notably, B2B accounts for 11.2% of PrestaShop stores versus 8.5% for WooCommerce — a gap explained by PrestaShop's capacity to handle custom pricing, restricted catalogues and purchasing workflows specific to business buyers.
Geography: where each platform dominates
The geographic distribution is one of the most surprising findings of this comparison: neither platform dominates any particular region. The territorial distribution of WooCommerce and PrestaShop is almost identical, with Île-de-France concentrating approximately 19% of stores for both platforms.
WooCommerce regional breakdown (top 8)
| Region | Share of WooCommerce stores |
|---|---|
| Île-de-France | 19.3% |
| Auvergne-Rhône-Alpes | 14.8% |
| Occitanie | 10.8% |
| Nouvelle-Aquitaine | 10.0% |
| Provence-Alpes-Côte d'Azur | 9.3% |
| Grand Est | 7.2% |
| Hauts-de-France | 6.0% |
| Pays de la Loire | 5.7% |
PrestaShop regional breakdown (top 8)
| Region | Share of PrestaShop stores |
|---|---|
| Île-de-France | 19.2% |
| Auvergne-Rhône-Alpes | 13.9% |
| Occitanie | 10.9% |
| Provence-Alpes-Côte d'Azur | 10.3% |
| Nouvelle-Aquitaine | 9.5% |
| Hauts-de-France | 8.0% |
| Grand Est | 7.3% |
| Pays de la Loire | 5.2% |
The geographic alignment is remarkable: the two regional rankings are almost identical. Unlike other indicators, geography does not differentiate the two platforms — they follow the same distribution as the French business landscape.
Company profiles: who uses each platform
It is on the company profile dimension that the divergence between WooCommerce and PrestaShop is clearest. Size, legal structure, age and TLD tell two opposing stories.
Company size
| Category | WooCommerce | PrestaShop |
|---|---|---|
| SME | 97.4% | 95.2% |
| Mid-market (ETI) | 2.3% | 4.3% |
| Large enterprise | 0.4% | 0.5% |
Legal structure
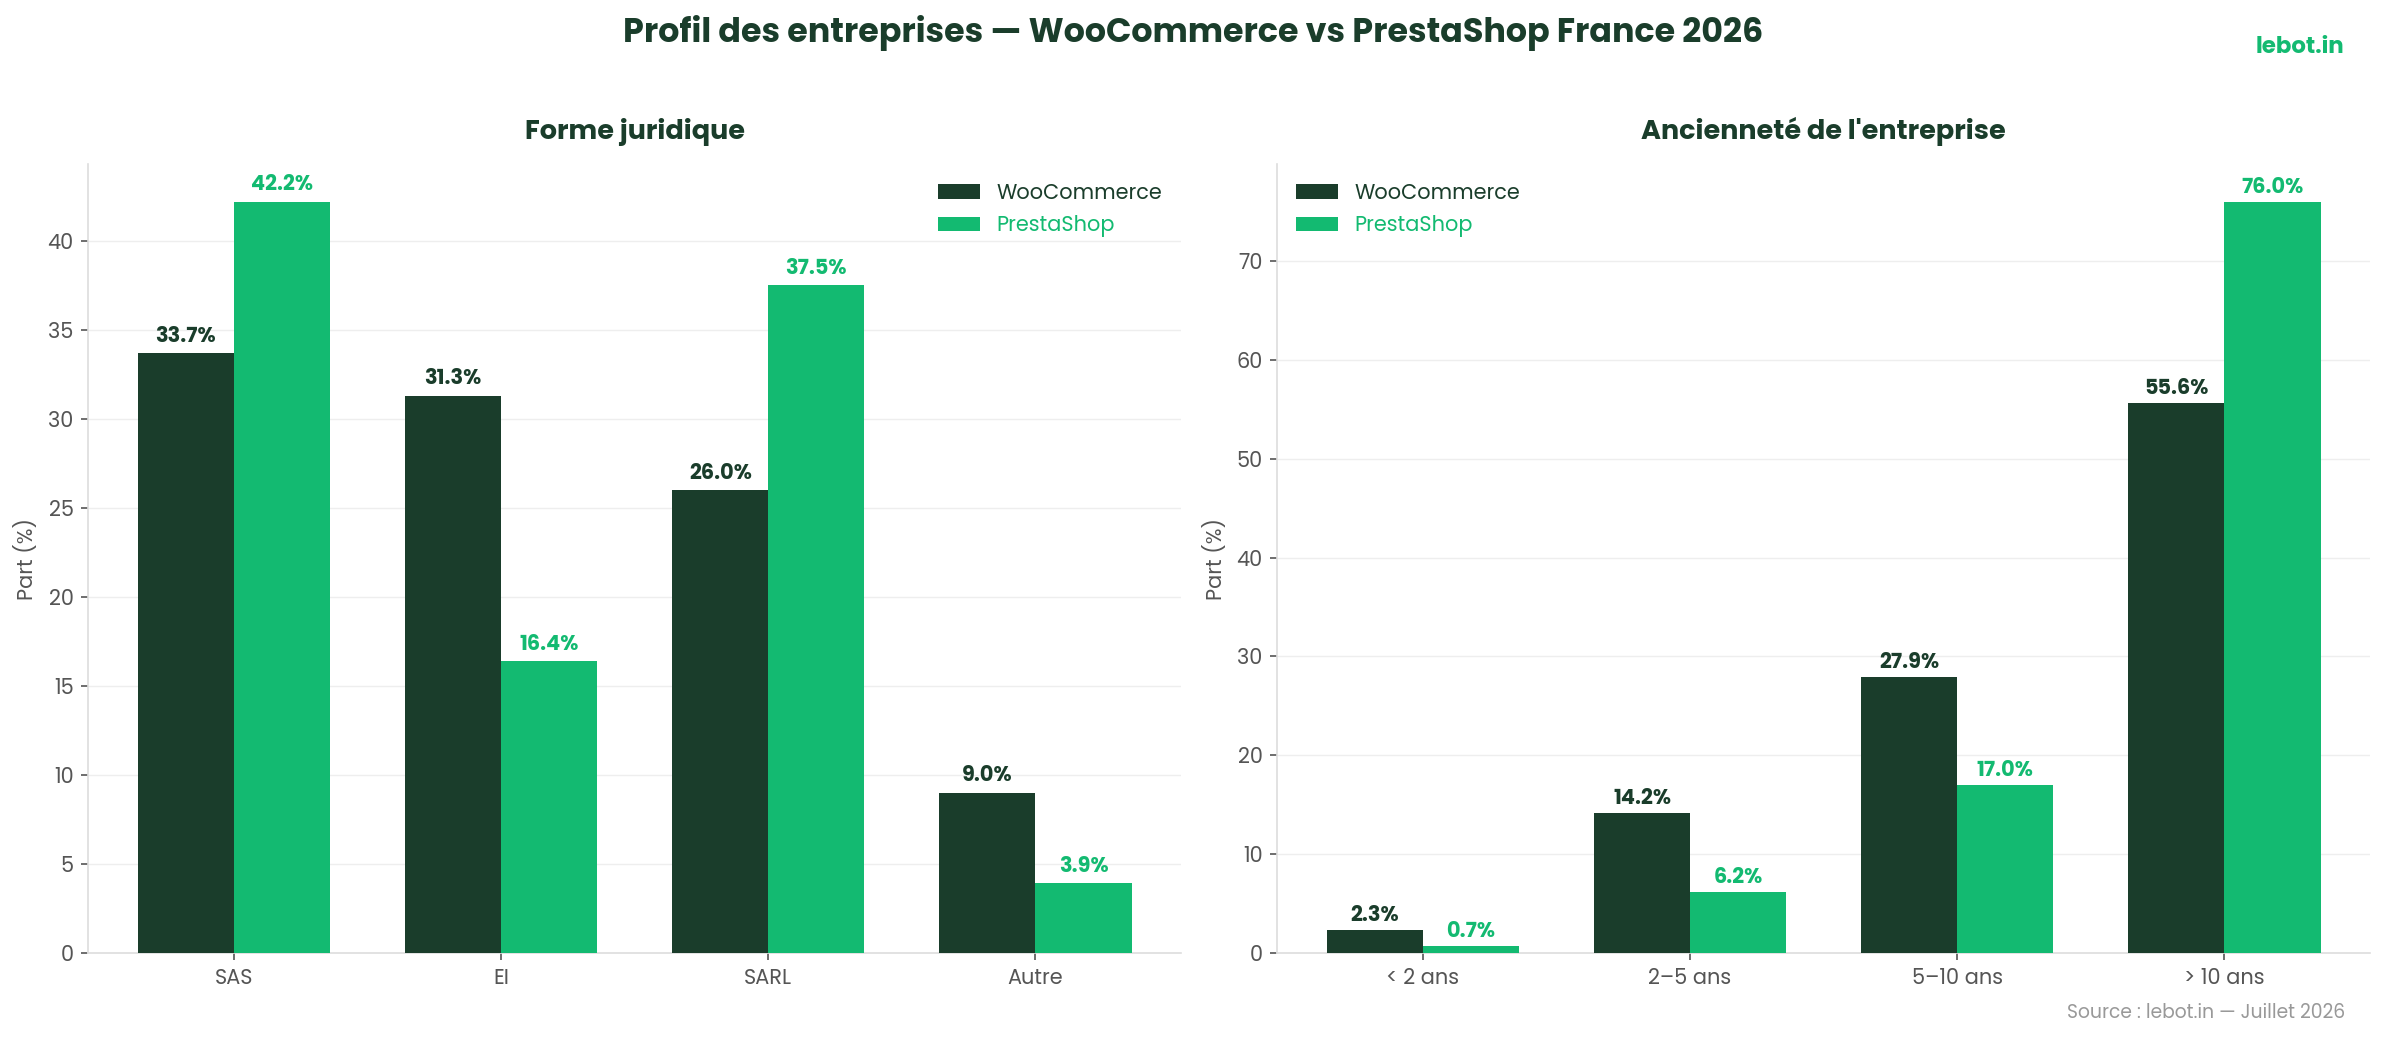
| Legal structure | WooCommerce | PrestaShop |
|---|---|---|
| SAS | 33.7% | 42.2% |
| EI (Sole Trader) | 31.3% | 16.4% |
| SARL | 26.0% | 37.5% |
| Association (non-profit) | 4.2% | 0.8% |
Company age
| Age bracket | WooCommerce | PrestaShop |
|---|---|---|
| < 2 years | 2.3% | 0.7% |
| 2 – 5 years | 14.2% | 6.2% |
| 5 – 10 years | 27.9% | 17.0% |
| > 10 years | 55.6% | 76.0% |
Domain extension (TLD)
| Extension | WooCommerce | PrestaShop |
|---|---|---|
| .fr | 61.2% | 48.6% |
| .com | 35.2% | 47.1% |
| .eu | 0.5% | 0.9% |
Legal structure is the most revealing indicator: 31.3% of WooCommerce stores belong to Sole Traders (EI) — almost double PrestaShop's figure (16.4%). WooCommerce also hosts 4.2% associations (non-profits), versus 0.8% for PrestaShop. PrestaShop concentrates more SAS (42.2%) and SARL (37.5%) — signals of more structured companies.
Company age is striking: 76% of PrestaShop stores belong to companies over 10 years old, versus 55.6% for WooCommerce. Conversely, WooCommerce hosts proportionally 3 times more companies under 2 years old (2.3% vs 0.7%). WooCommerce is the entry point for new merchants; PrestaShop is the platform of established merchants.
GMV distribution and revenue
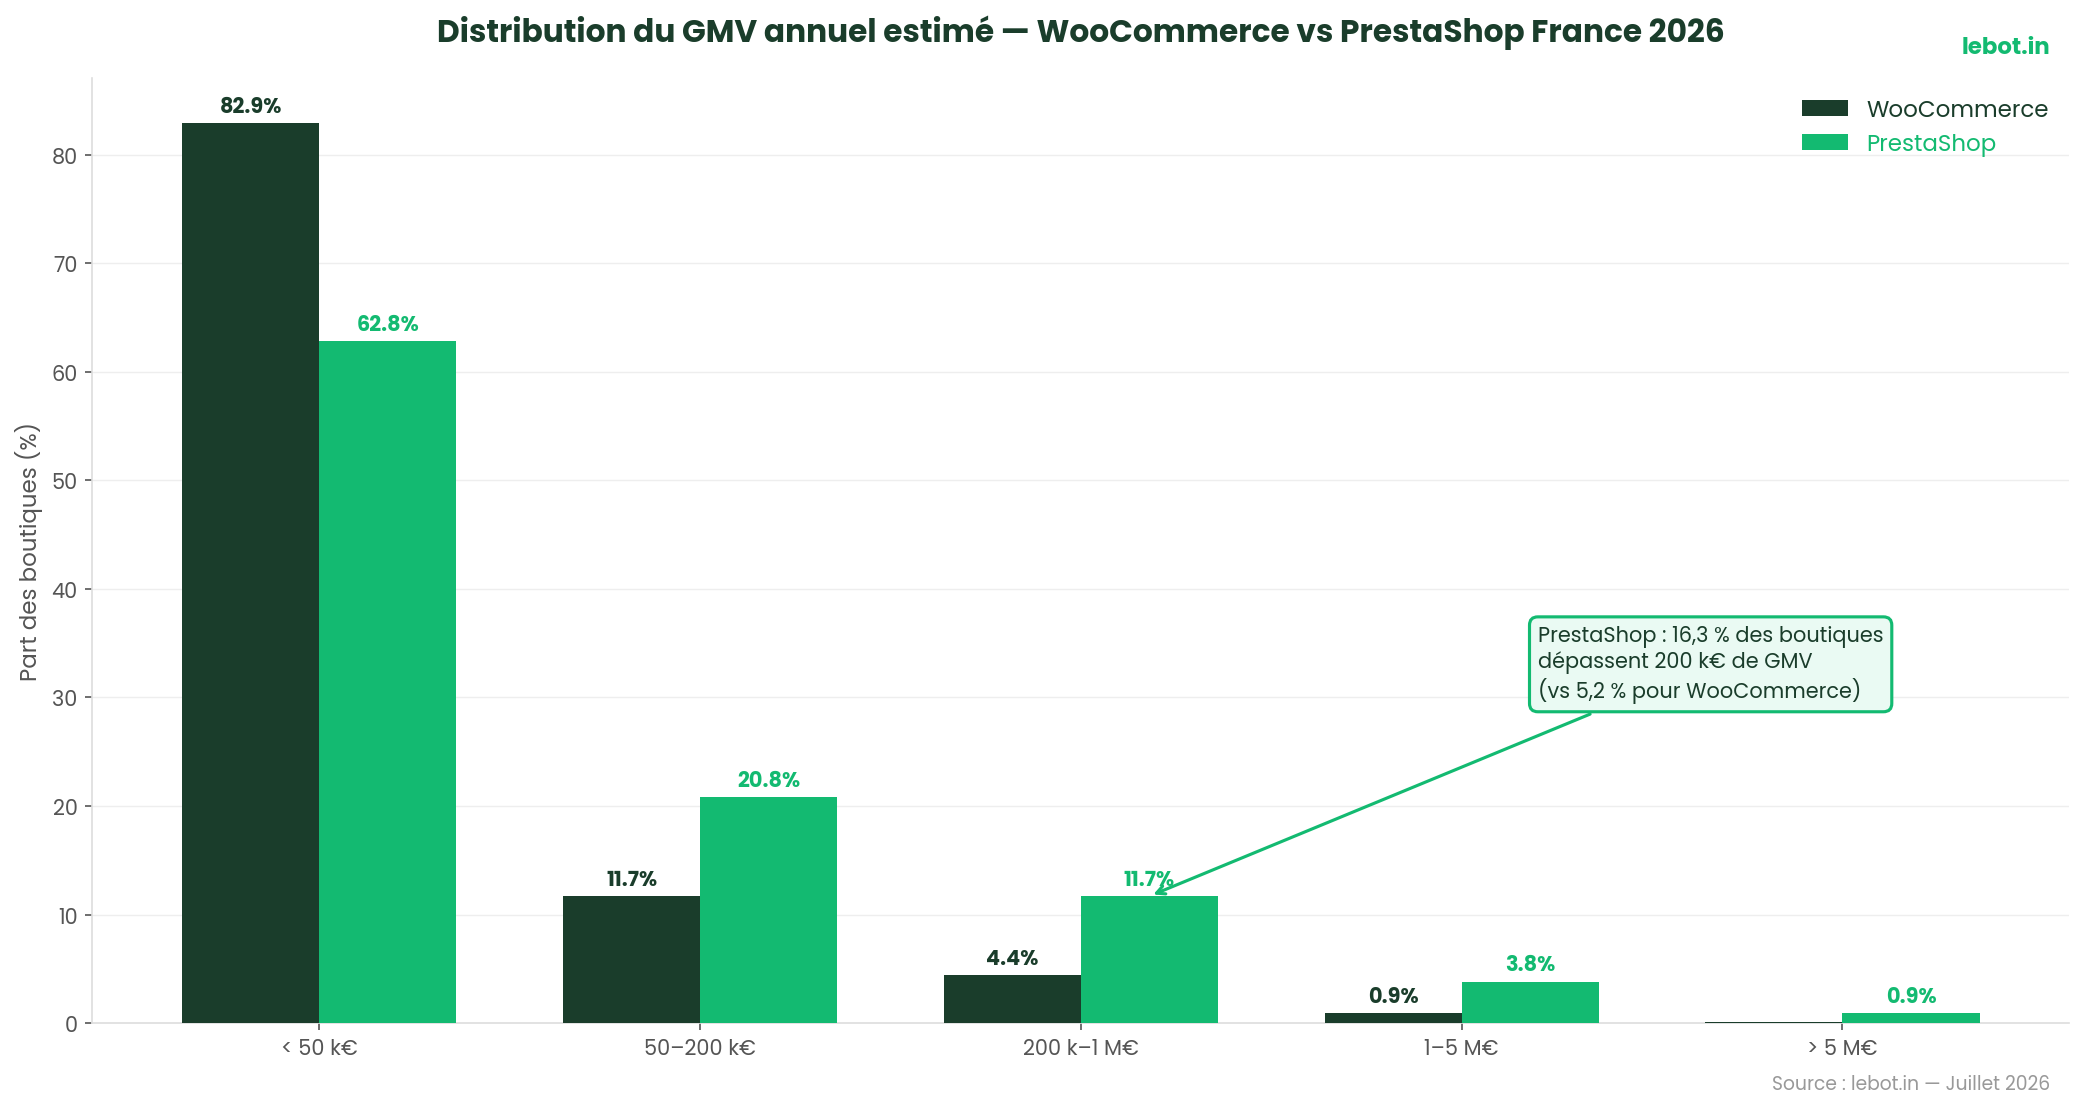
The GMV distribution by bracket confirms and amplifies previous observations on merchant profiles. WooCommerce is a low-volume platform; PrestaShop is a mid- and high-volume platform.
| Annual GMV bracket | WooCommerce | PrestaShop |
|---|---|---|
| < €50,000 | 82.9% | 62.8% |
| €50,000 – €200,000 | 11.7% | 20.8% |
| €200,000 – €1,000,000 | 4.4% | 11.7% |
| €1,000,000 – €5,000,000 | 0.8% | 3.8% |
| > €5,000,000 | 0.1% | 0.8% |
82.9% of WooCommerce stores generate less than €50,000 in annual GMV, compared to 62.8% for PrestaShop. At the other end, PrestaShop stores exceeding €1m GMV represent 4.6% of the ecosystem, versus only 0.9% for WooCommerce. In absolute volume, PrestaShop has approximately 945 stores generating over one million euros in annual GMV, compared to about 540 for WooCommerce — even though WooCommerce has 3 times as many stores.
Verdict: which platform for which use case
WooCommerce and PrestaShop are not direct competitors in the French market: they address fundamentally different merchant profiles. The platform choice is not a question of "better technology" but of alignment with the company's profile, its maturity level and its commercial ambitions.
Choose WooCommerce if
You are a craftsperson, creator, independent worker or non-profit. You already have a WordPress site or want to combine blog and e-commerce in a single environment. Your catalogue is of reasonable size, your marketplace ambitions are limited, and you prioritise editorial flexibility over catalogue power. The Arts and Crafts, Health and Beauty and Food and Beverage sectors find naturally fertile ground here.
Choose PrestaShop if
You are an established merchant with a formalised legal structure (SAS, SARL), a catalogue of several hundred to several thousand items, and advanced needs in variant management, pricing, discount rules or logistics modules. PrestaShop is the natural platform for merchants wanting to integrate French marketplaces: with 20.7% marketplace presence, the PrestaShop ecosystem has deep historical roots with Cdiscount (17.9% of Cdiscount sellers with a webshop use PrestaShop, versus 3.4% for WooCommerce). Home and Garden, Fashion and Apparel, Automotive and Consumer Goods are the sectors that thrive best here.
For B2B teams
B2B accounts for 11.2% of PrestaShop stores versus 8.5% for WooCommerce. PrestaShop has a more mature base of B2B modules. To access the full list of B2B merchants by platform, region and sector, visit the lebot.in database.
Frequently asked questions
Which platform is more popular in France?
WooCommerce is the most popular by store count: 59,778 active stores in France as of July 2026, versus 20,555 for PrestaShop. However, this popularity in site numbers does not translate to dominance in revenue generated — PrestaShop wins on that criterion.
Which platform generates more revenue in France?
PrestaShop generates more cumulative GMV: €5.4 billion per year versus €4.1 billion for WooCommerce. A PrestaShop store generates a median €52,097/year, which is 2.4 times the median GMV of a WooCommerce store (€22,046/year).
What type of business uses each platform?
WooCommerce: 31.3% Sole Traders and 4.2% non-profits. PrestaShop: 42.2% SAS and 37.5% SARL. Company age: 76% of PrestaShop companies have been trading over 10 years, versus 55.6% for WooCommerce.
Is PrestaShop more present on French marketplaces?
Yes: 20.7% of PrestaShop stores are present on at least one marketplace, versus only 4.2% for WooCommerce. On Cdiscount in particular, PrestaShop accounts for 17.9% of sellers with a webshop (versus 3.4% for WooCommerce).
How many WooCommerce and PrestaShop stores are there in France in 2026?
As of July 2026: 59,778 active WooCommerce stores and 20,555 active PrestaShop stores in France, totalling 80,333 stores. These figures cover exclusively stores whose SIREN appears in their legal notice and is active in the INSEE register.
Methodology
The data comes from the lebot.in July 2026 database, comprising 155,000 French e-commerce companies verified by SIREN. The full methodology is available here.
Counted are e-commerce stores whose SIRET number appears in their legal notice, is active in the INSEE register and whose registered office is located in France. CMS detection is performed by analysis of technology signatures of active sites. Monthly traffic is measured via SimilarWeb. Annual GMV is estimated through cross-modelling: sector × traffic segment × estimated conversion rate × sector average basket, calibrated on available public data (Fevad, listed merchant annual reports). Sector classification uses the NAF-lebot.in nomenclature, harmonised from INSEE APE codes.
Further reading
Complete this analysis with other comparisons from the lebot.in database:
- Shopify vs WooCommerce France 2026 — 89,000 stores compared
- PrestaShop vs Shopify France 2026 — 52,000 stores compared
- WooCommerce in France – April 2026 — 57,515 stores, 74 leaders
- PrestaShop in France — May 2026 — 23,366 stores, €5.9bn GMV
Your prospects are in our database. Let's talk.
Our team is available to present the solution and help you build your first e-commerce prospect segment.
Book a meeting →